
The Foothills Corridor - Chapter 20: Metrics that Matter: Measuring Real Change

Chapter 20: Metrics that Matter: Measuring Real Change
You can’t fix what you don’t track—and you can’t celebrate what you don’t measure. For the Foothills Corridor, where energy is precious and attention is scattered, having the right metrics is not just a bureaucratic exercise. It’s a strategic imperative.
The region doesn’t need more dashboards. It needs a common language of progress—one that connects counties, aligns institutions, and shows residents that their daily realities are being heard and improved.
What’s Wrong With Traditional Metrics
Traditional economic development has relied heavily on a narrow band of indicators:
· Number of jobs “created.”
· Square footage of real estate developed.
· Amount of outside investment attracted.
These metrics aren’t wrong—but they’re incomplete. They miss:
· Whether those jobs are livable.
· Whether that real estate is accessible.
· Whether that investment stays in the community or leaks out.
In the Foothills, where communities are often playing catch-up, metrics must go beyond vanity stats. They must reflect real change.
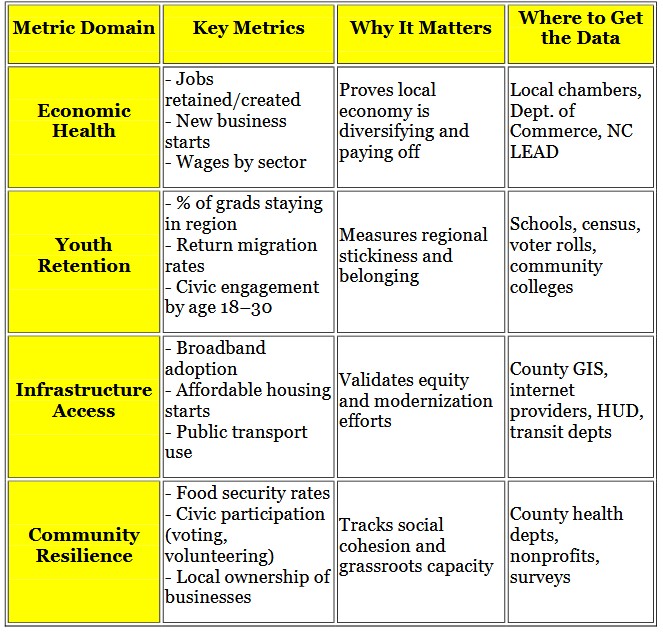
“The Foothills Metrics Framework”
What gets measured drives what gets funded. These four metric domains give counties and collaborators a shared dashboard to track real—not cosmetic—regional progress.
1. Use 1 metric from each domain to build your grant case or county scorecard
2. Track trends year-over-year, not just point-in-time snapshots
3. Use disaggregated data when possible (race, income, geography)
A New Scorecard for the Corridor
What if the region measured itself not just by what it adds—but by what it sustains, strengthens, and secures? Here’s a baseline set of metrics that could matter more:
1. Youth Retention
· Percentage of high school grads who stay in the region for work or further education.
· Number of returnees under 35 who relocate back each year.
2. Job Quality and Career Mobility
· Median wages by industry.
· Percentage of jobs with benefits.
· Number of adults accessing upskilling or credentialing annually.
3. Small Business Growth
· Number of new local businesses launched per year.
· Five-year business survival rate.
· Local share of procurement spending.
4. Housing and Affordability
· New affordable units built.
· Percentage of income spent on housing.
· Commute times and transportation access.
5. Broadband and Digital Access
· Percentage of households with high-speed internet.
· Number of students with access to home connectivity.
· Public Wi-Fi access points added.
6. Health Equity and Wellness
· Preventable ER visits per capita.
· Access to behavioral and mental health services.
· Food insecurity rates and local food hub reach.
7. Civic Engagement
· Voter turnout in local elections.
· Participation in public planning processes.
· Number of youth and resident advisory boards formed.
8. Regional Collaboration
· Joint grant applications submitted.
· Shared infrastructure projects underway.
· Inter-county workforce or housing initiatives launched.
Why These Metrics Matter
Each of these measures centers people, place, and participation—not just abstract growth. They tell the story not just of what’s built, but of what’s better. They track the long game, not the headlines.
More importantly, these metrics can help:
· Prioritize funding.
· Align cross-county strategy.
· Communicate progress to the public.
· Push back on narratives of decline.
They turn data into direction.
From Metrics to Momentum
Measuring well is only the first step. The region must:
· Publicly report on these metrics annually.
· Benchmark against peer regions.
· Reward communities that move the needle.
· Adjust strategies based on what the data says.
Measurement isn’t about control—it’s about clarity. And in a region like the Foothills, clarity is fuel. Metrics are only useful if they’re public, consistent, and tied to action—not just reports.
Because when the community sees itself—truthfully, fairly, and completely—it’s far more likely to believe that change is not just possible. It’s measurable. It’s visible. And it’s already underway.
Overcoming Barriers: When Measurement Becomes Manipulation
Everyone talks about accountability—until the numbers stop telling the story they want. The barrier to real metrics in the Foothills isn’t technology or access. It’s political will. Too many agencies cherry-pick stats, dress up failure as progress, or bury inconvenient truths under layers of PR gloss.
The deeper problem? We’ve normalized metrics that don’t measure what matters. We track ribbon-cuttings, not retention. We count jobs created, but not whether those jobs pay enough to live here. We highlight grant wins, but not the long-term outcomes of those investments. Economic development gets graded on inputs and intentions—not results.
Collaboration also stalls when every county uses a different scoreboard. One place tracks broadband adoption; another tracks fiber miles. One counts GED completions; another reports program enrollment without follow-up. The result is a fog of data that justifies stagnation.
Breaking through this requires uncomfortable honesty. Shared metrics won’t emerge until leaders agree on what actually counts. That might mean building a neutral regional data trust—or forcing hard conversations about what failure really looks like.
But until that happens, we’ll keep mistaking motion for progress. And the Foothills Corridor deserves better than performative measurement. It deserves truth.